Who won the platinum strike? The figures speak

After the historic five-month long platinum strike, mineworkers and corporate executives are retreating to their tin shacks and BMWs respectively. The country is left wondering: who won?
What the increases mean for the lives of the workers and the fortunes of the platinum producers is difficult to quantify. However, it is possible to compare the implications – for workers and company costs – of the various offers, demands and the final settlement.
What do the demands, offers and settlement consist of?
A wage package can be sliced into basic wage, cash remuneration (which is basic wage + living out allowance + other allowances + holiday bonus and 13th cheque), and the total package (which is cash remunerations + medical + pension).
The various offers and demands entail different increases to different aspects of the package and over different time periods. The offers or demands also entail different increases for the different wage bands: A-, B- and C-level workers; A-level being the lowest paid, and C-level the highest paid (of those wages under negotiation).
Because the final settlement covers three years, only three years worth of data for all offers/demands is presented here, even if that offer originally extended over four or five years. All data here is the average for all three companies (Amplats, Implats and Lonmin) combined.
· AMCU Demand 1, R12,500 immediately: The original AMCU demand was for an immediate increase of the lowest basic wage to R12,500. This is not shown graphically here as it makes it impossible to read the graphs but it amounts to an approximate 125% increase on the average basic wage for A-Level employees, and 85% increase on the total package, after which wages would presumably increase in line with inflation.
· AMCU Demand 2, R12,500 over four years: The revised AMCU demand was to achieve a R12,500 basic wage over four years. This was proposed as a R1,800 increase to the basic wage each year for four years for A- and B-level workers, with other aspects of the package rising in line with inflation, except for the holiday allowance which increased in sync with the basic wage, and 8.5%, 8%, 7.5% and 7.5% increases for C-level workers.
· Offer 1, 21 January 2014: At the outset of the strike the platinum producers offered 8% to 8.5% increases for A- and B-level workers and 7.5% for C-level employees for three years.
· Offer 2, 29 January 2014: This offer was increased to 9%, 8% and 7.5% increases for A-level workers over three years, 8.5%, 7.5% and 7.5% for B-level and 7.5%, 7% and 7% for C-level.
· Offer 3, 17 April 2014: A further offer was made to reach R12,500 in cash remuneration over 5 years. This meant increases of between 7.5% for the highest paid to 10% for the lowest paid. The report Demanding the Impossible? Platinum Mining Profits Wage Demands in Context used this offer (abridged report here full report here)
· Settlement, 24 June 2014: For A- and B-level workers the final settlement entails a R1,000 increase to the basic wage for the first and second year for all companies, and for Lonmin in the third year, and a R950 increase for Amplats and Implats in the third year, and a 8%, 7.5% and 7.5% for C-level workers. (If an A- or B-level workers reaches a basic of R12,500 in year two they receive the 7.5% increase, not R1,000/R950 increase, for the third year, although the difference is marginal.) Changes to the living out allowance varies across companies (but in general is very low) with all other aspects of the package – including allowances previously tied to the basic wage – increasing in line with inflation.
The AMCU 4-year demand, the producers’ three offers and the settlement are compared below (and contrasted against inflationary increases of 6%).
Increases for the Workers
The mineworkers are of course most concerned with what the settlement means for them. Figures 1 and 2 show the increases for A-, B- and C-level workers for the basic wage and the total package. Figure 1 shows percentage increases achieved each year and Figure 2 the nominal rand amounts that result (that is, the amount the workers will take home each year, not adjusted for inflation).
A higher resolution PDF of the wage offer comparison graphs can be viewed here.

We see in all of these that the final settlement is considerably higher than the initial offer made by the producers.
For the lowest paid (A-level) the basic wage increases by 18.1%, 15.3% and 12.6% over three years (average: 15.4%), and the total package by 12.7%, 10.7% and 9.3% (average: 10.9%). This is a significant degree higher than the 7.5% to 8.5% increases of the initial offer and represents a real gain for workers.
We can also see that the final settlement is substantially lower than the AMCU demand (averaging at 25.6% for basic and 19.4% for total package over three years). In fact, the gap between the AMCU demands and the settlement is greater than the gap between the producers’ first offer and the settlement. At first glance this tells us that AMCU compromised more than the producers – this finding is qualified in the next section which looks at the impact on the total cost to company of the wage increase for all three bands combined.
We see in Figure 2 that the lowest wage band will on average reach a basic salary of approximately R8,500 by the end of the agreement, well short of the R12,500 demanded.

It is clear from Figure 1 that the greatest percentage increases were made to the basic wage of A-level employees followed by B-level employees. This is the consequence of the formula used, adding a fixed amount of R1,000 to basic wages (as this amounts to a higher percentage the lower the current wage).
Interestingly, increases for already better-paid C-level employees are lower in the final settlement than in the last offer made by the companies – although this conclusion should be viewed with caution because the 17 April 2014 offer was vague with regards to these employees and the most generous interpretation was used.
What is highlighted is that the key concern was for increasing the basic wages of the lower paid even if this meant lower increases for the higher paid and lower increases in other aspects of the package, for instance the final settlement has lower percentage increases to aspects of the cash remuneration than the 17 April offer.
Total Cost to Company
To try grapple with “who won” we need to look at the impact on the overall total cost to company of the increases over three years for all three bands of workers combined (averaged over the three companies). This is what is done in Figure 3.
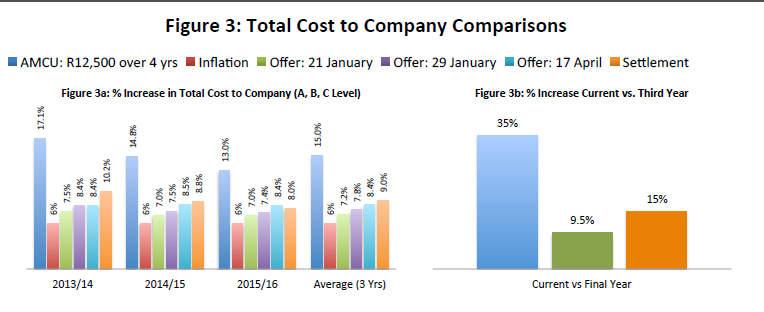

Figure 3a shows the impact of all the various offers/demands/settlement on total cost to company in percentage terms for the three years and on average over the years. The AMCU demand implied an average increase of 15% compared with the original offer of 7.2% and the final settlement of 9%.
The 9% is fairly modest. Despite higher increases to the lowest paid and to basic salaries the platinum producers were able to restrain the total cost to company by freezing certain allowances, raising almost all non-basic wage components of the package by inflation only, and limiting increases to those already better paid.
Figure 3b shows the increase from the current total cost to company compared with the total cost to company in the third year. For the AMCU demand this is an increase of 34.9%, for the original offer it is 9.6% and for the wage settlement it amounts to 15.2% (adjusted to 2013 rands).
Figures 3c and 3d illustrate how far both AMCU and the producers have “moved” from their original demand and offer respectively, in order to settle on the final agreement.
In Figure 3c the percentage increases for the original offer, the AMCU demand and the final settlement for the three years and the average are shown. We see here that the final settlement is much closer to the original offer than to the AMCU demand. This suggests AMCU “moved” a greater deal further than the producers did.
However, another way to think about this is in percentage terms. What percent of their demand did AMCU give up on and by what percent of their original offer did the producers increase?
To explain: let’s say the settlement was 8%, AMCU’s demand was 12% and the producers’ original offer was 6%. AMCU’s moving from 12% to 8% (a 4% movement) represents a decrease of 33% if one compares their demand with the settlement, the producers’ increase from 6% to 8% (a 2% movement) represents a 25% increase on their original offer. So even though AMCU (in this example) “moved” twice as far as the producers’ (4% vs. 2%) the extent to which they compromised on their original positions, in percentage terms, is much closer: 33% compared with 25%.
This is what is shown in Figure 3d for the three years, on average and comparing the current total cost to company with the cost in the last year. Here we note that, on average, the final settlement is 40% lower than the increase demanded by AMCU, and 25% higher than the original offer made by the producers. This again indicates that AMCU made greater compromises.
This conclusion is partially contradicted when we look at the final column in Figure 3d. This is based on the comparison of the current total cost to company with the cost in the last year (as in Figure 3b). It shows that this percentage increase, between current and year 3, is 56% lower than AMCU wanted (35% vs 15%) but 59% higher (15% vs 9.5%) than what would have been the case with the producers’ original offer. When measured in this manner both moved considerably from their starting point.
So who won?
Considerable gains were made by workers in the course of the 5-month long strike.
The original offer amounted to an average yearly increase of 7.7% to the total package of the lowest paid, the final settlement came to a yearly average of just shy of 11%, an almost 3.5% gain. But this 11% is much lower than the 19.4% average yearly increases demanded by AMCU (Figure 1).
The platinum producers have conceded ground but they have also managed to keep the overall cost to the company down. While the original offer was very low, a measly 7.2% overall average yearly increase, the final offer, which implies a 9% overall average yearly increase, is not a terrible blow.
The settlement is likely to improve the lives of the workers, but not radically alter their circumstances. The settlement is also not likely to cause a radical upheaval within the operations of the companies (particularly Amplats and Implats) who given a buoyant platinum price and strong global demand, can be cautiously optimistic about the future.
Given the desperate poverty and growing inequality across South Africa without far-reaching structural change in the economy this will not be the last tenaciously contested wage dispute we shall see.
Gilad Isaacs (@GiladIsaacs) is an independent economist and researcher. He is co-author of a report titled [Demanding the Impossible? Platinum Mining Profits and Wage Demands in Context which appears in an abridged version and a full version. He writes in his personal capacity, and not behalf of the organisations publishing the report or his co-author.

Next: The plight of informal street traders
Previous: Activists put mainstream media under the spotlight

This article is licensed under a Creative Commons Attribution-NoDerivatives 4.0 International License.